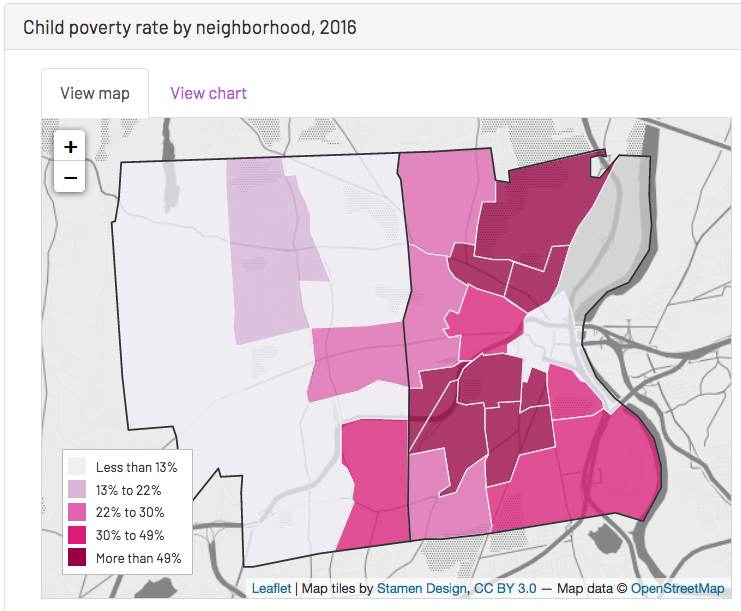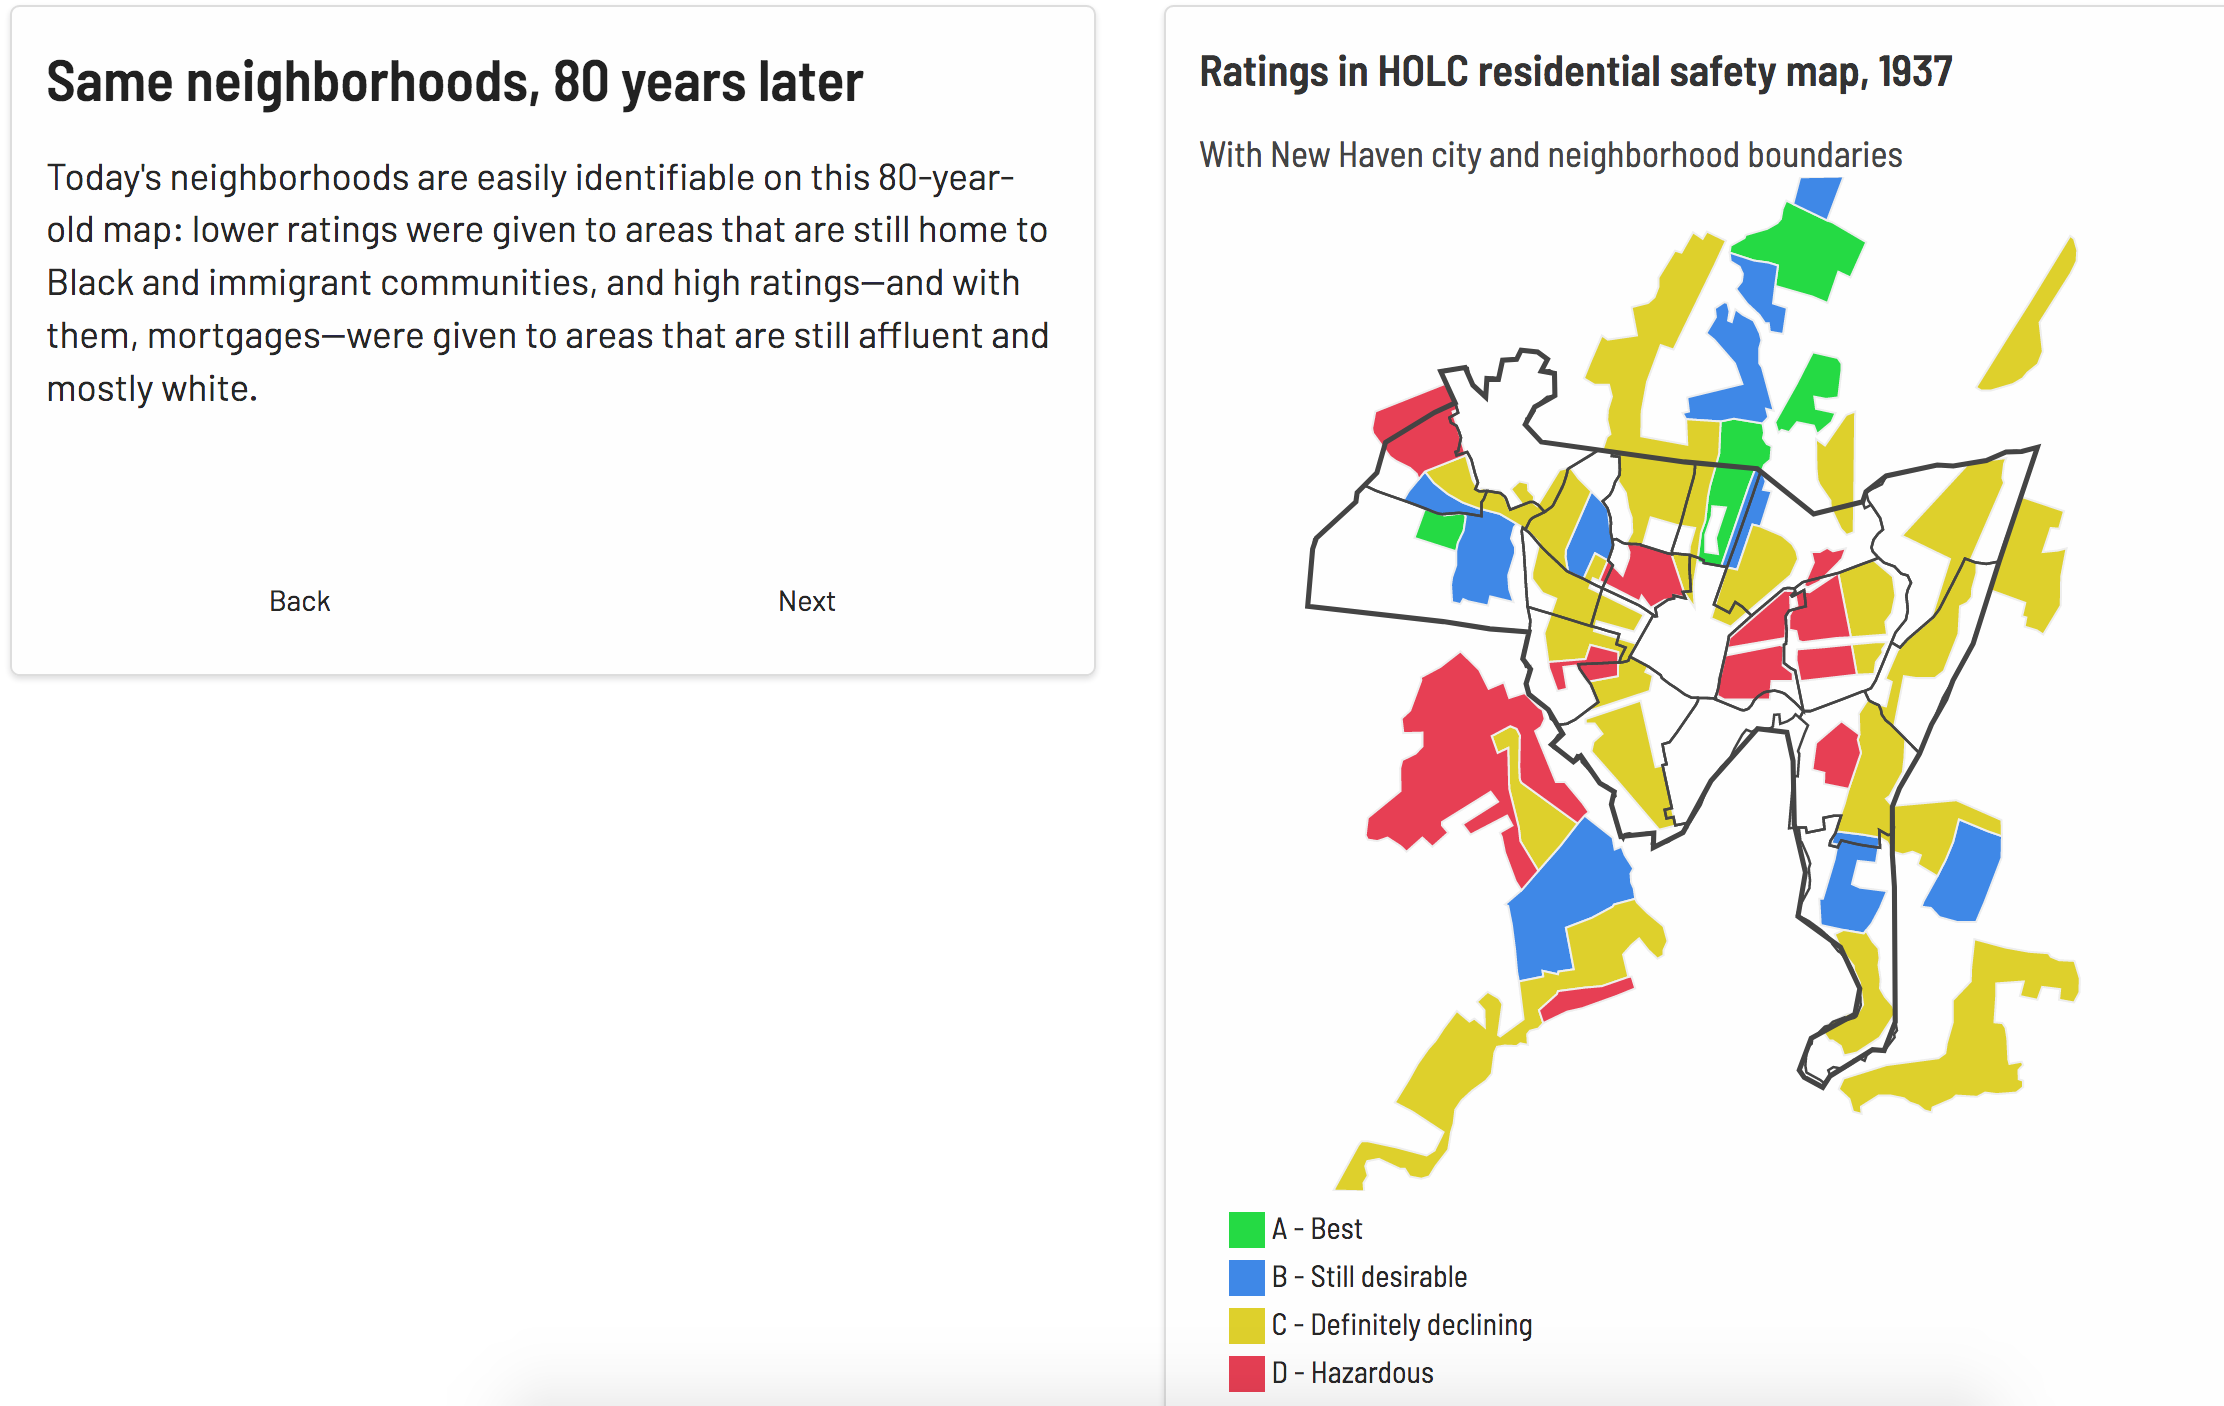
A visual deep-dive into the history of racial segregation in Greater New Haven’s housing and the patterns that remain today.
A visual deep-dive into the history of racial segregation in Greater New Haven’s housing and the patterns that remain today.
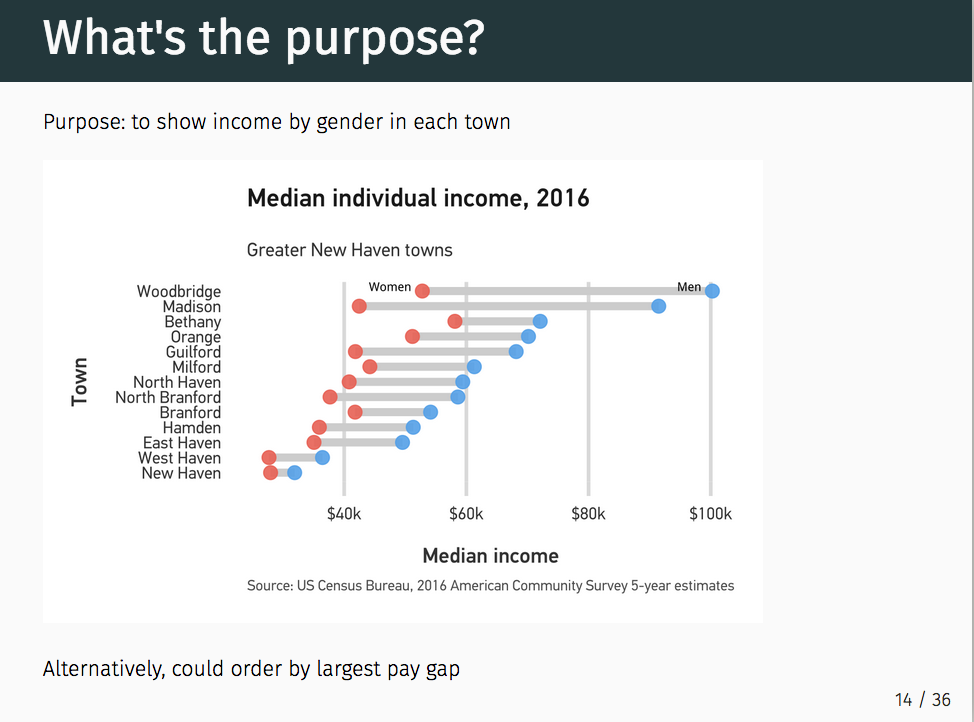
Slides (with tons of links!) from a workshop on data visualization, especially geared towards nonprofit folks
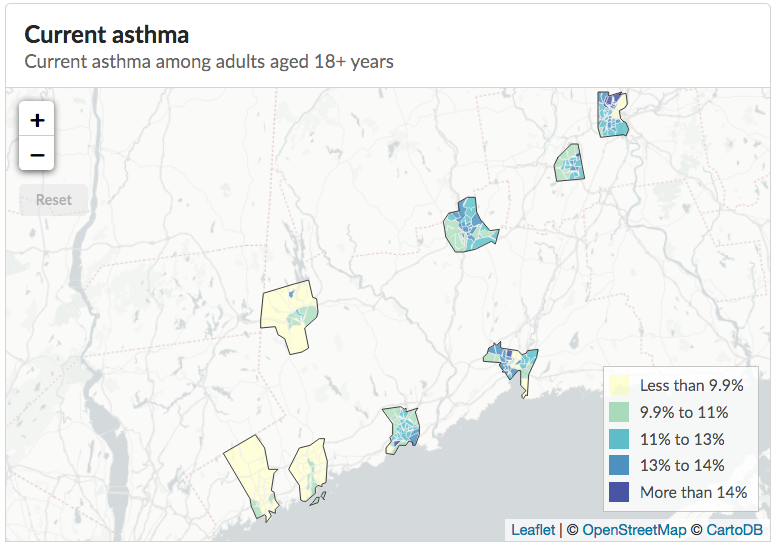
Visualization of Connecticut data from the 500 Cities Project, a CDC and Robert Wood Johnson Foundation collaboration of local-level public health data.
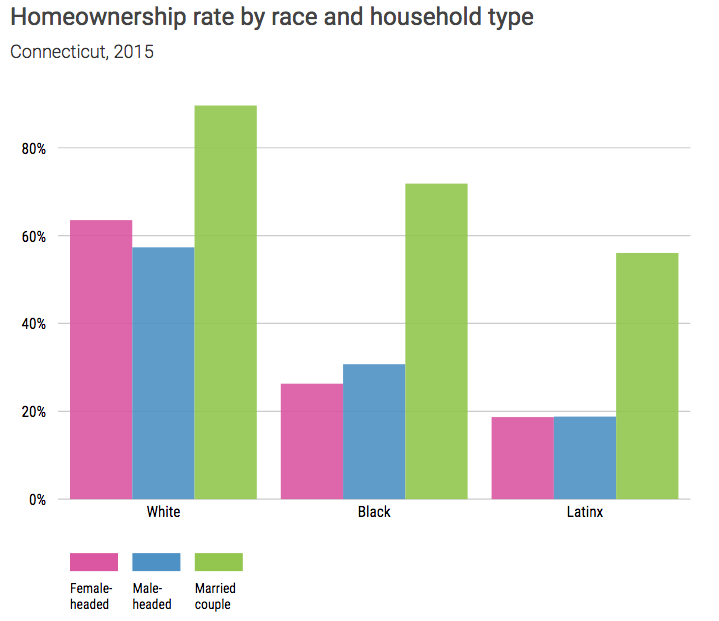
Visual exploration of the uneven landscape of financial security across Connecticut.
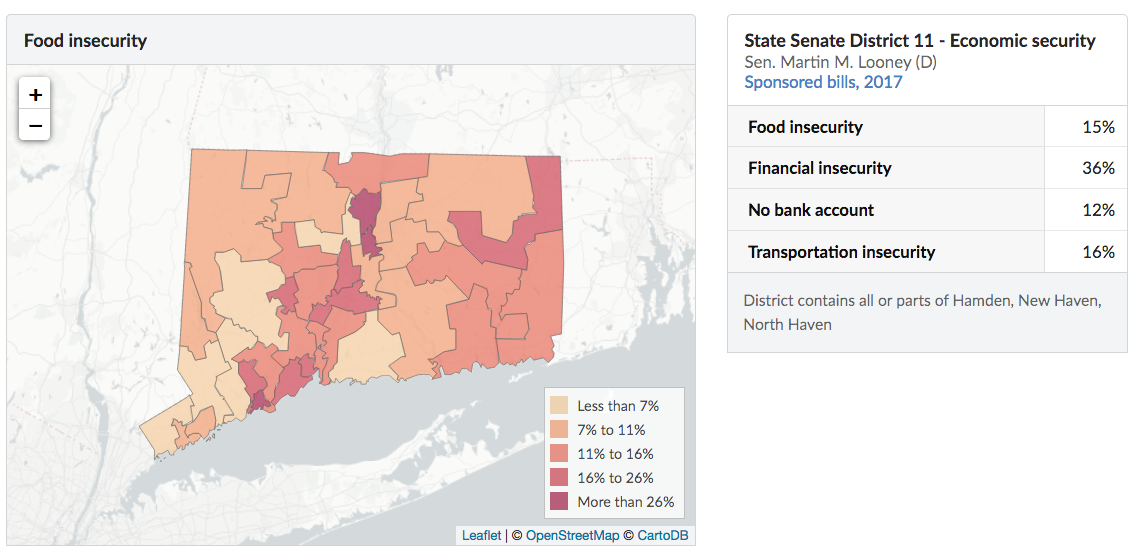
Maps of Census data for Connecticut’s state House and Senate districts, plus DataHaven Community Wellbeing Survey data for Senate districts. Includes statewide comparisons, information on each district’s legislator, and overviews of each district as printable PDF downloads. We see this as a way to supply information in support of advocacy.
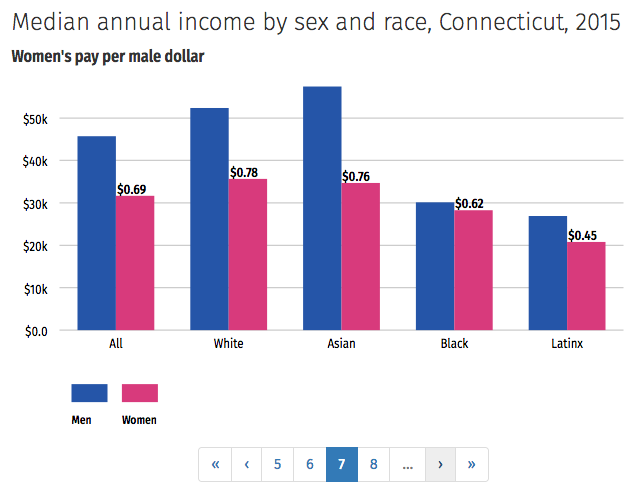
Visual exploration of the wage gap(s) in Connecticut by gender, race, education, occupation, and their overlaps.